Engagement with the TCFD Recommendations
Basic approach
The Group considers environmental problems such as climate change to be important issues for management to address. Based on this awareness, we defined practicing ESG management as one of the challenges in our 2030 Vision announced in May 2021, and set environmental, social, and governance KPIs respectively as well as specific targets in Medium-Term Management Plan (2021–2025), which we are working systematically and continuously to achieve.
We will actively engage in eco-friendly business practices, which include reducing greenhouse gas emissions, while also working actively to contribute toward solutions for climate-related social issues through businesses such as renewable energy.
Additionally, in December 2021 we declared our support for the recommendations of the TCFD (Task Force on Climate-related Financial Disclosures) and also joined the TCFD Consortium. The Group is making information disclosures according to the TCFD Framework.
Addressing the TCFD recommendations
(Updated June 2026) (446KB)
* Previous files are at the bottom of the page.
TCFD published its final report in June 2017 and recommended that companies disclose the following information pertaining to their governance, strategies (risks and opportunities, financial and other impacts, handling), and other initiatives.

| Governance | Strategy | Risk management | Metrics and goals |
|---|---|---|---|
| Monitoring systems and the role of the management team pertaining to climate-related risks and opportunities | Identifying climate-related risks and opportunities and their impacts on the organization’s businesses, strategy, and financial planning | The processes used by the organization to identify, assess, and manage climate-related risks | The metrics and goals used to assess and manage relevant climate-related risks and opportunities |
Governance
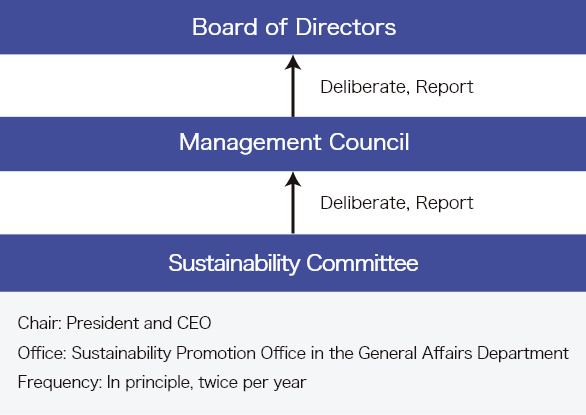
- The EXEO Group has established the Sustainability Committee chaired by the President and CEO and has established the Sustainability Promotion Office in the General Affairs Department as a dedicated organization for sustainability, primarily for taking measures against climate change. The aims of these actions are to help achieve a sustainable society, and to bolster efforts toward the continued growth of the EXEO Group.
- The Sustainability Committee was established as an advisory body to the Management Council. It discusses the direction of sustainability, material issues, target setting and other subjects. It monitors the status of activities and reports the details of its deliberations to the Management Council and the Board of Directors.
- The Sustainability Promotion Office within the General Affairs Department operates as the administrative office of the Sustainability Committee. It also plays a role in setting the EXEO Group's targets and managing the progress of various sustainability measures mainly addressing climate change, human rights and natural capital in cooperation with Group companies.
| Meeting Body | FY | Details |
|---|---|---|
| Board of Directors (Management Council) | 2023 |
|
| 2024 |
|
|
| Sustainability Committee | 2023 |
|
| 2024 |
|
*This information is for the most recent two years.
Strategy
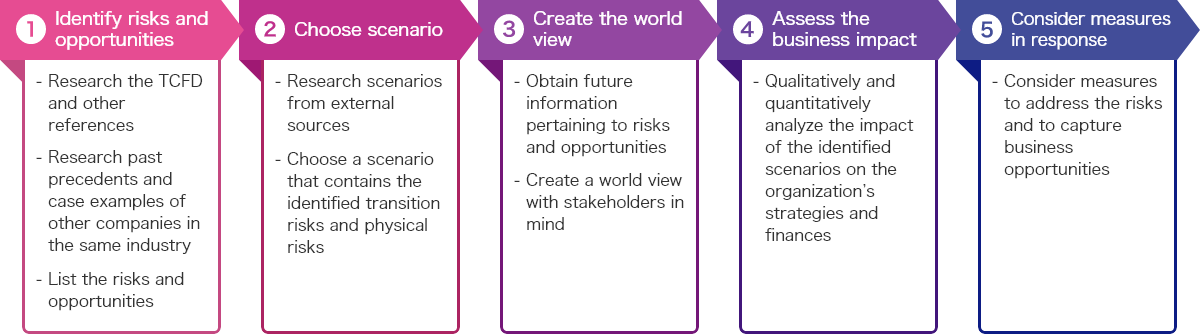
We use scenario analyses to anticipate what the world will be like in 2030 to ascertain the impact that climate change will have on our Group’s business. The primary information sources for our analyses were the 1.5°C scenario by the International Energy Agency (IEA), and the 4°C scenario by the Intergovernmental Panel on Climate Change (IPCC).
Scenario analysis steps
Key hypotheses
| No. | Key hypotheses used in scenario analysis | 2030 | 2050 | Source | |
|---|---|---|---|---|---|
| 1 | Introduction of the carbon tax | Carbon tax value | 140 USD/t-CO2 | 250 USD/t-CO2 | IEA WEO2024 (figures of developed countries in the NZE scenario) |
| 2 | Emissions controls | Carbon tax value | 140 USD/t-CO2 | 250 USD/t-CO2 | IEA WEO2024 (figures of developed countries in the NZE scenario) |
| 3 | Emissions controls | Penalties under the EU Emissions Trading System (EU- ETS) | 100 EUR/t-CO2 | 100 EUR/t-CO2 | EU ETS Handbook |
| 4 | Emissions controls | EU-ETS trading price | 70.28 EUR/t-CO2 | 70.28 EUR/t-CO2 | Average trading price under the EU-ETS in the last twelve months |
| 5 | CO2 reduction cost | Renewable energy certificate purchase price | 1.2 yen/kWh | 3.2 yen/kWh | Estimated by the Company based on materials published by the Agency for Natural Resources and Energy's System Consideration Working Group |
| 6 | Progress in energy saving and renewable energy technologies | Working-age population | 70.67 million people | 55.29 million people | National Institute of Population and Social Security Research: Population Projections for Japan |
| 7 | Intensification of extreme weather | Frequency of flooding | 1.5 times higher | 2.33 times higher | Estimated by the Company based on materials published by the Ministry of Land, Infrastructure, Transport and Tourism's study meeting on technologies for flood control plans in view of climate change |
| 8 | Temperature rise | Work loss rate | 2.71% | 3.23% | Estimated by the Company based on data published by the International Labour Organization (ILO) (on lost working hours due to heat stress) |
| 9 | Products and services | Offshore wind power generation market size | 2.2 times larger | 5.0 times larger | Agency for Natural Resources and Energy: FY2030 energy supply and demand forecast (title tentatively translated) Ministry of Economy, Trade and Industry: Japan’s power generation amount (2050) (title tentatively translated) |
| 10 | Services for climate change mitigation and adaptation | Market size of ZEB | ¥5,020.0 billion | ¥6,820.0 billion | Ministry of the Environment: Estimation of market size and employment in the environmental industry (title tentatively translated) |
Scenario analysis results
1.5°C scenario (scenario in which the necessary measures were taken to keep temperature rises to 1.5°C compared to pre-industrial levels)
| Type | Climate change factor | Impact on the Group | Timeline of impact*1 | Level of impact*2 | Key response measures | |
|---|---|---|---|---|---|---|
| 2030 | 2050 | |||||
| Risks | Introduction of the carbon tax |
|
Medium / Long | ▼8 | ▼0 |
|
| Emissions controls |
|
Medium / Long | ▼0 | ▼2 |
|
|
| CO2 reduction cost |
|
Short / Medium / Long | ▼1 | ▼2 | ||
| Surging raw materials prices |
|
Short / Medium / Long | - | - |
|
|
| Obligation to disclose information |
|
Short / Medium / Long | ▼1 | ▼1 |
|
|
| Progress in energy saving and renewable energy technologies |
|
Short / Medium / Long | ▼▼14 | ▼▼95 |
|
|
| Changing customer preferences |
|
Short / Medium / Long | - | - |
|
|
| Stakeholder assessments |
|
Short / Medium / Long | - | - | ||
| Opportunities | Construction work related to renewable energy |
|
Short / Medium / Long | ▲▲ | ▲▲ |
|
| Market expansion |
|
Short / Medium / Long | ▲ | ▲ |
|
|
| Services to mitigate and adapt to climate change |
|
Short / Medium / Long | ||||
| Adaptation to climate change |
|
Short / Medium / Long |
|
|||
| Stakeholder assessments |
|
Short / Medium / Long | - | - |
|
|
4°C scenario (scenario in which measures to counter climate change are insufficient, and temperatures rise by approximately 4°C compared to pre-industrial levels)
| Type | Climate change factor | Impact on the Group | Timeline of impact*1 | Level of impact*2 | Key response measures | |
|---|---|---|---|---|---|---|
| 2030 | 2050 | |||||
| Risks | (Acute) Intensification of extreme weather |
|
Medium / Long | ▼7 | ▼▼19 |
|
| (Chronic) Temperature rise |
|
Medium / Long | ▼▼12 | ▼▼16 |
|
|
*1 Timeline of impact: Short time line: 3 years or less, Medium time line: Over 3 and up to 10 years, Long time line: Over 10 years
*2 Financial impact (profit) on business activities of the Group in fiscal 2030 and in fiscal 2050 is calculated assuming certain conditions and expressed in billions of yen. Anticipating the relative magnitudes, risks are expressed as “▼▼▼ (large), ” “▼ (medium) ” and “▼ (small) ” and opportunities as “▲▲▲ (large), ” “▲▲ (medium) ” and “▲ (small). ” Impact scale in financial terms is (large): ¥10.0 billion or more, (medium): From ¥1.0 billion to less than ¥10.0 billion, and (small): Less than ¥1.0 billion.
Risk management
For our Group’s risk management system, we have formulated the Risk Management Rules that specify the basic points involved in risk management and have established risk categories in addition to the Risk Management Division that handles them. We have also established the Business Risk Management Committee as the Group-wide risk manager, as we build and operate systems to identify and evaluate risks on a Group-wide level.
Risks associated with climate change are chiefly identified and assessed by the Sustainability Committee. Information is also shared and coordinated in deliberations on individual matters in the Business Risk Management Committee, which includes verifying climate-related risks.
Based on the Risk Management Rules, these are also integrated into Group-wide processes and matched against risks that have been assessed and identified in environmental management systems based on the ISO14001 international standard, and occupational health and safety management systems based on the ISO45001 international standard.
Metrics and goals
The Group has defined and is monitoring the following metrics and goals for managing climate-related risks and opportunities.
Roadmap: Reduction targets and performance trends
In-house emissions (Unit: thousand t-CO2)

Emissions from other companies related to business activities (Unit: thousand t-CO2)

Sub-metrics
| FY2020 | FY2022 | FY2023 | FY2024 | Targets for FY2025 | Scope of data | |
|---|---|---|---|---|---|---|
| Switch to electricity from renewable energy sources | ー | 73.2% | 77.8% | 94.5% | 100% | Company-managed sites of Exeo Group, Inc. |
| Adoption of EVs and other low-emission vehicles | 91.4% | 96.1% | 96.7% | 96.8% | 100% | Sales vehicles of Exeo Group, Inc. |
| Targets for FY2030 | Scope of data | |
|---|---|---|
| Substantial renewable energy conversion of rental properties | 100% | Consolidated |
| Introduction of fuel efficiency improvers (company) | 100% | Consolidated Construction vehicles |
GHG emissions by Scope (units: t-CO2, scope of data: consolidated)
| Base year (FY2020) | FY2023 | FY2024 | Difference | % change | |
|---|---|---|---|---|---|
| Scope 1 (Direct emissions) |
86.3 | 71.7 | 66.9 | −19.4 | −22.4% |
| Scope 2 (Indirect emissions) |
60.4 | 60.6 | 58.8 | −1.6 | −2.6% |
| Total (Scopes 1 & 2) | 25.9 | 11.1 | 8.1 | −17.8 | −68.8% |
| Scope 3 (Supply chain) |
1,757.0 | 1,264.4 | 1,164.9 | −592.2 | −33.7% |
| Category 1 (Purchased products) |
275.9 | 173.7 | 212.3 | −63.6 | −23.0% |
| Category 2 (Capital goods) |
41.5 | 70.2 | 72.3 | 30.8 | 74.3% |
| Category 3 (Fuel- and energy-related activities) |
12.7 | 13.0 | 12.8 | 0.2 | 1.2% |
| Category 5 (Waste generated in operations) |
2.4 | 4.6 | 3.9 | 1.5 | 60.4% |
| Category 6 (Business travel) |
1.9 | 2.2 | 2.2 | 0.4 | 20.1% |
| Category 7 (Commuting) |
3.4 | 4.0 | 4.1 | 0.7 | 20.1% |
| Category 11 (Use of sold products) |
1,418.4 | 995.8 | 837.8 | −580.6 | −40.9% |
| Category 13 (Downstream leased assets) |
0.9 | 0.8 | 19.4 | 18.5 | 1,987.1% |
* Difference and % change are calculated in t-CO2 units.
* The greenhouse gas emitted by the Group is carbon dioxide (CO2).
* Numerical values for the base year could be subject to change if applicable scope or calculation methods change as we make these calculations more sophisticated going forward, or if an event that exceeds the course of our business growth occurs.
Implementation of reduction measures

Previous initiatives

External evaluation
-
We declared our support for the recommendations of the Task Force on Climate-related Financial Disclosures (TCFD) while also joining the TCFD Consortium, consisting of companies and financial institutions that agree with the recommendations.
-

In order to further strengthen our efforts to combat climate change, we have joined the Japan Climate Leaders Partnership (JCLP), an organization that supports companies in their efforts to combat climate change.