


Stock Quotes (TSE First Section:1951)
2025/06/20 15:30
01 Orders received
.webp)
02 Net sales
.webp)
03 Operating income
.webp)
04 Net income attributable to owners of parent
.webp)
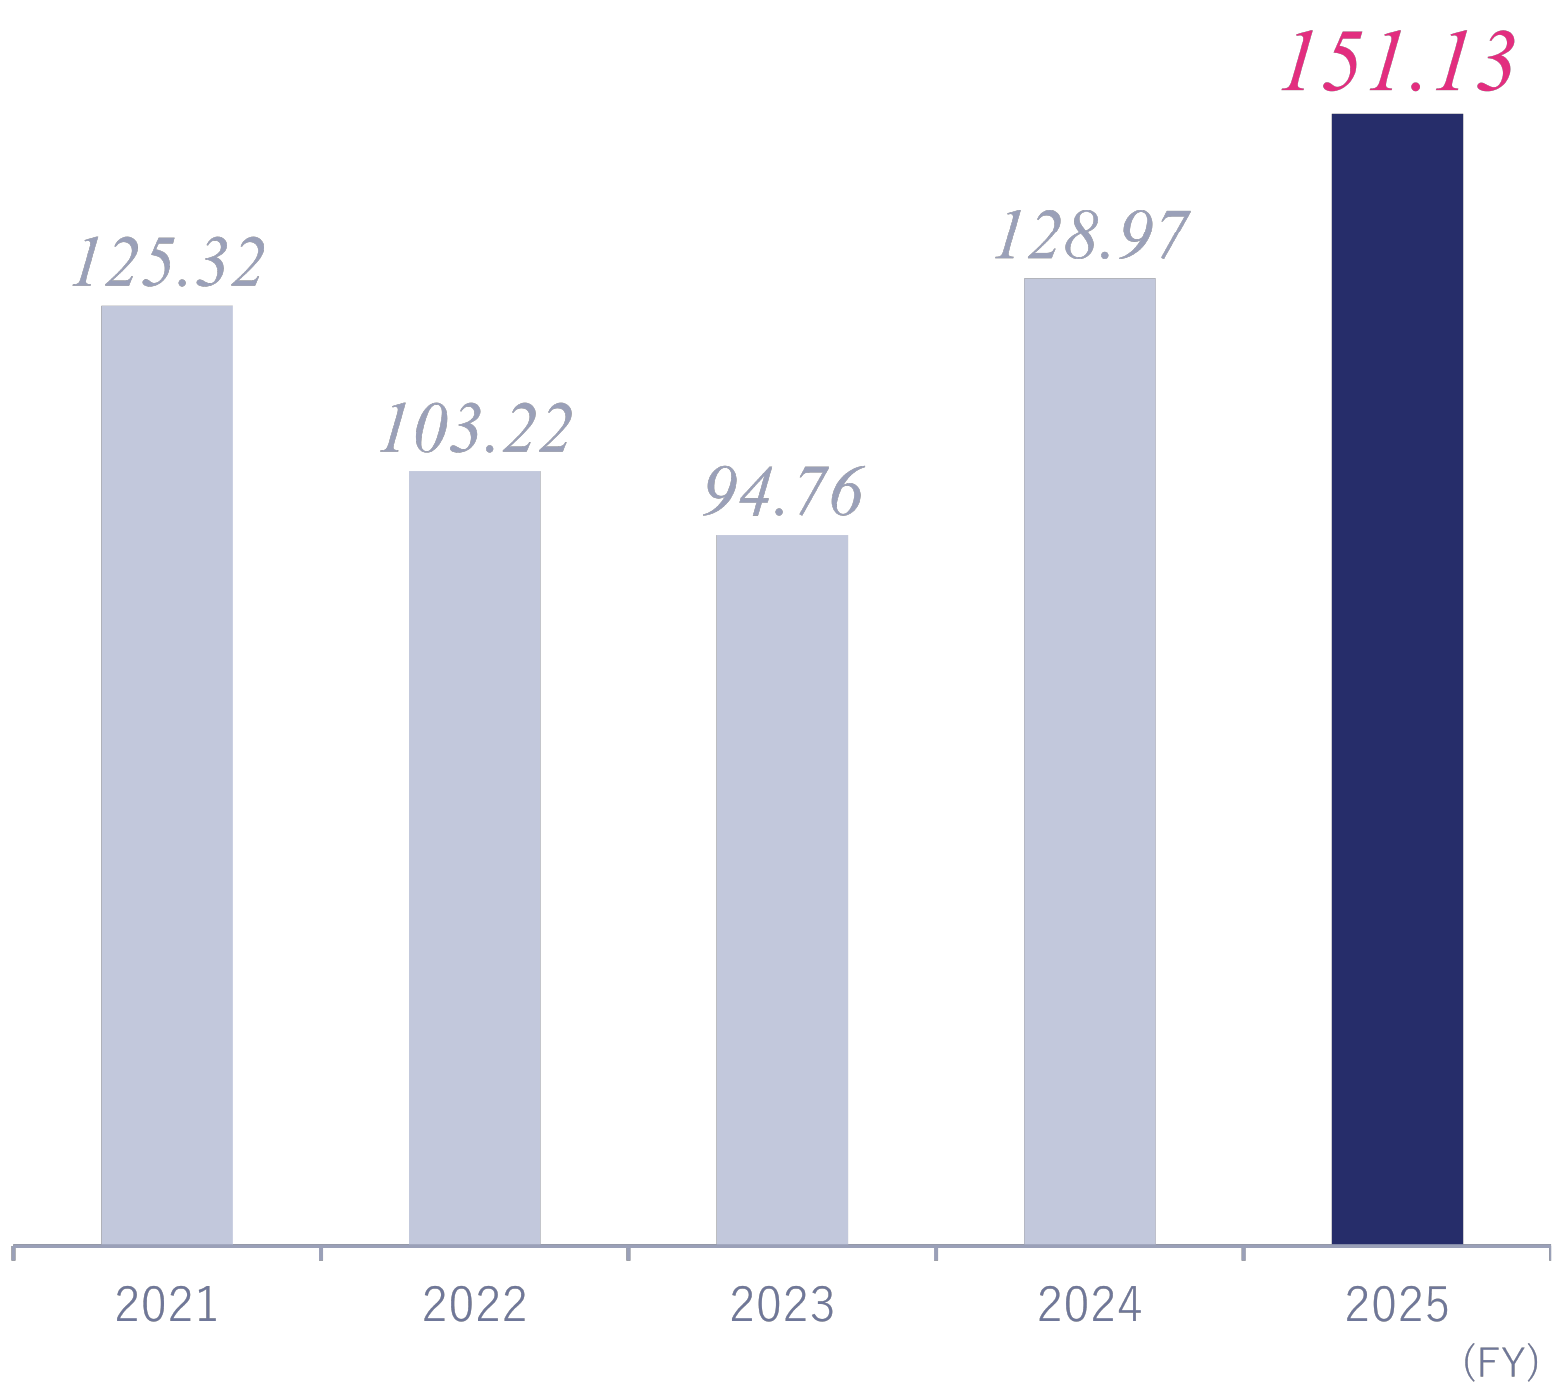
05 Earnings Per Share
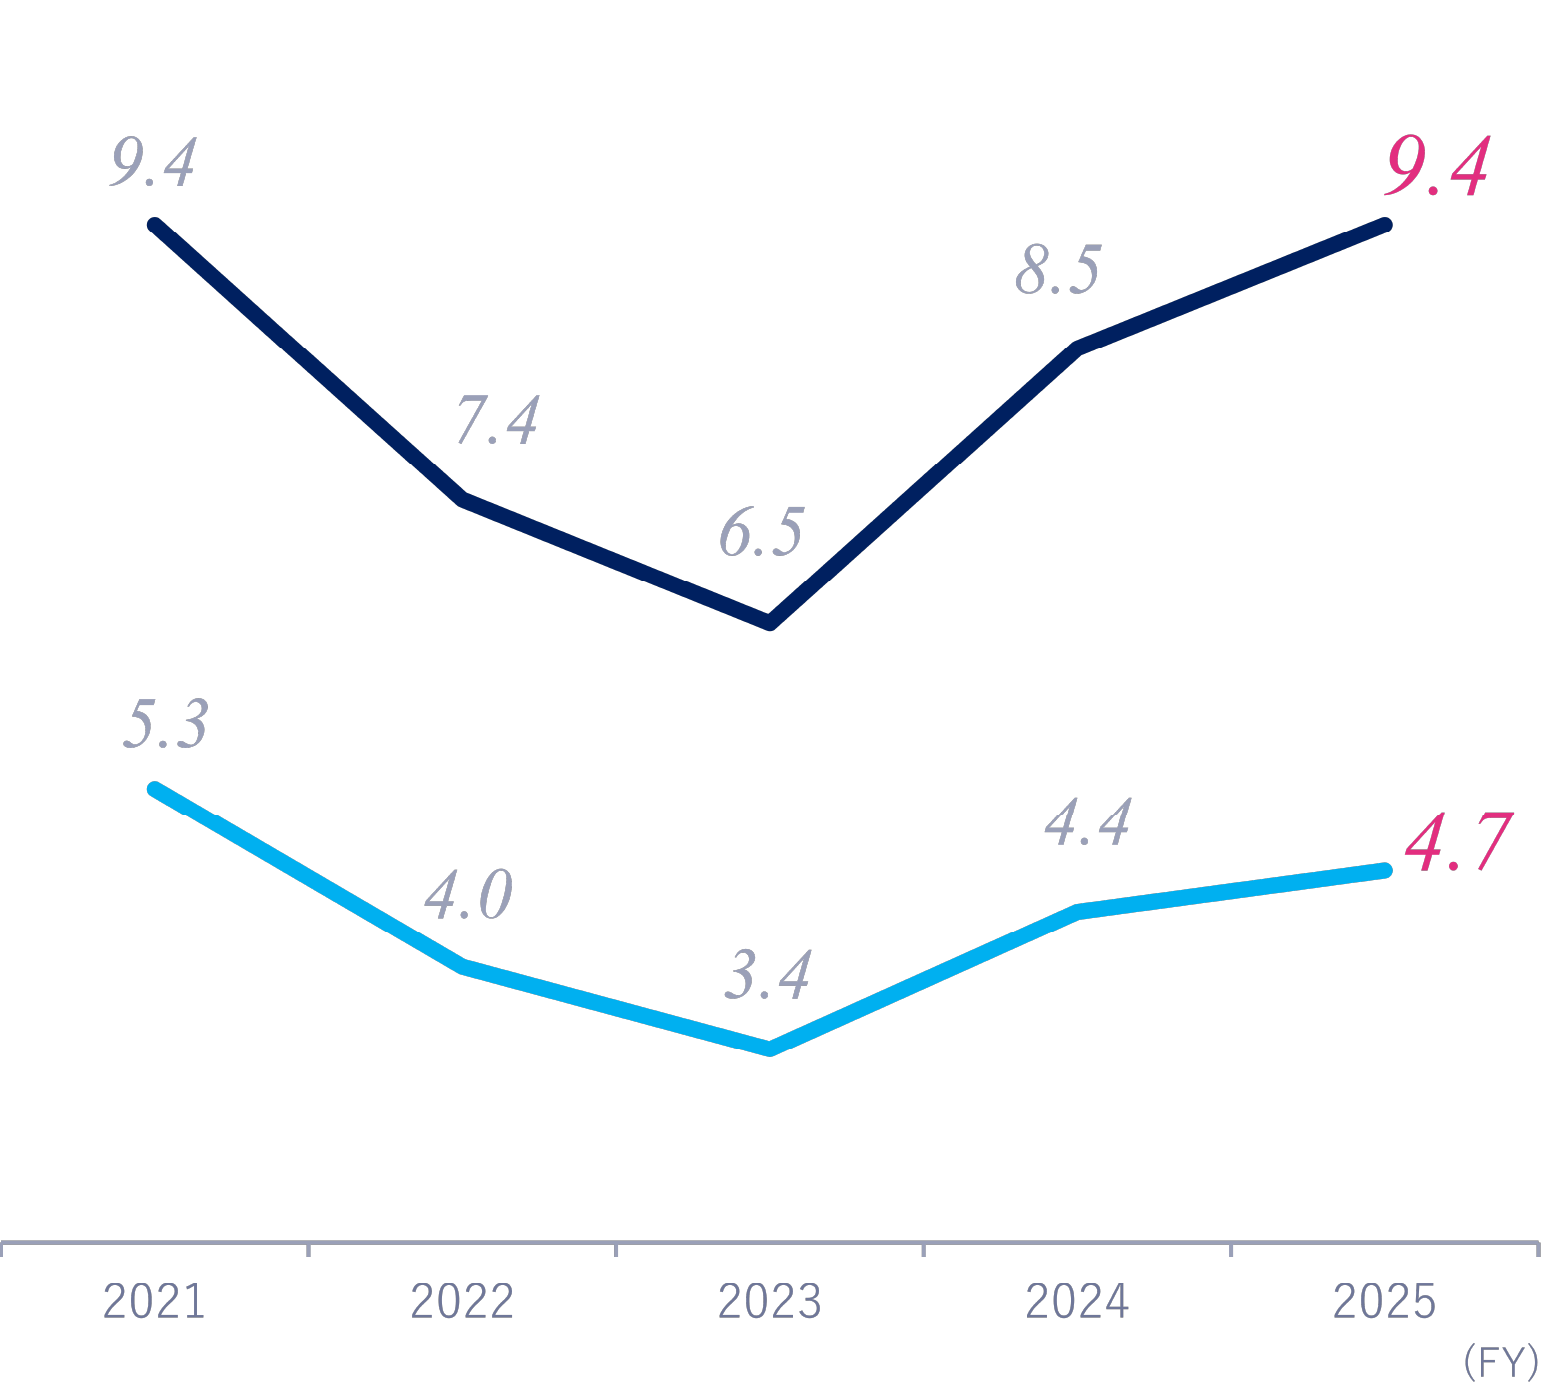
06 ROE/ROA
01 Consolidated Statements of Income
(¥billion)
| FY21 | FY22 | FY23 | FY24 | FY25 | ||
|---|---|---|---|---|---|---|
| Orders received | 595.3 | 625.6 | 656.5 | 712.4 | 811.8 | |
| Net sales | 594.8 | 627.6 | 614.0 | 670.8 | 787.7 | |
| Gross Profit | 84.3(14.2%) | 81.8(13.0%) | 89.1(14.5%) | 100.4(15.0%) | 114.6(14.6%) | |
| Selling, General and Administrative Expenses | 41.9(7.1%) | 49.2(7.9%) | 55.0(9.0%) | 58.0(8.6%) | 62.6(8.0%) | |
| Operating Income | 42.3(7.1%) | 32.5(5.2%) | 34.1(5.6%) | 42.4(6.3%) | 52.0(6.6%) | |
| Ordinary Income | 45.2(7.6%) | 33.7(5.4%) | 36.9(6.0%) | 43.5(6.5%) | 52.7(6.7%) | |
| Profit attributable to owners of parent | 27.7(4.7%) | 22.3(3.6%) | 20.0(3.3%) | 26.8(4.0%) | 31.0(3.9%) | |
02 Consolidated Balance Sheets
(¥billion)
| FY21 | FY22 | FY23 | FY24 | FY25 | ||
|---|---|---|---|---|---|---|
| Current assets | 326.6 | 353.7 | 347.8 | 387.7 | 417.0 | |
| Non-current assets | 208.9 | 224.2 | 243.7 | 254.7 | 274.1 | |
| Total assets | 535.6 | 577.9 | 591.6 | 642.5 | 691.1 | |
| Liabilities | Current liabilities | 157.7 | 159.0 | 177.7 | 206.6 | 212.8 |
| Non-current liabilities | 70.8 | 110.7 | 94.6 | 109.1 | 131.5 | |
| Total liabilities | 228.5 | 269.9 | 272.5 | 315.7 | 344.4 | |
| Shareholders’ equities | 303.3 | 303.3 | 313.2 | 321.0 | 342.0 | |
| Subscription rights to shares, Non-controlling interests | 3.6 | 4.7 | 5.9 | 5.7 | 4.6 | |
| Total assets | 535.6 | 577.9 | 591.6 | 642.5 | 691.1 | |
03 Consolidated statements of cash flows
(¥billion)
| FY21 | FY22 | FY23 | FY24 | FY25 | ||
|---|---|---|---|---|---|---|
| Net cash provided by (used in) operating activities | 26.4 | 5.4 | 41.9 | 6.8 | 33.2 | |
| Net cash provided by (used in) investing activities | -20.3 | -13.3 | -13.5 | -18.4 | -14.9 | |
| Net cash provided by (used in) financing activities | 5.0 | 3.2 | -30.5 | 2.8 | -16.5 | |
| Free cash flow | 6.0 | -7.8 | 28.3 | -11.5 | 18.2 | |
| Increase in cash and cash equivalents due to share exchange | 1.4 | 1.0 | -0.5 | 0.6 | 0.2 | |
| Cash and cash equivalents at end of period | 53.7 | 50.2 | 47.4 | 39.4 | 41.3 | |
Learn more